Robust gene dys-regulation in Alzheimer’s brains
Treating and preventing Alzheimer’s disease (AD) requires better understanding of the disease mechanism. The brain transcriptome of AD reflects the prevailing disease mechanism at the gene expression level. However, thousands of genes have been reported to be dys-regulated in AD brains in existing studies, and the consistency or discrepancy among these studies has not been thoroughly examined.
Towards this end, Prof. LEI Hongxing’s lab at Beijing Institute of Genomics, Chinese Academy of Sciences (BIG), conducted a comprehensive survey of the brain transcriptome datasets for AD and other neurological diseases and selected 100 genes most frequently dys-regulated in AD brains which were validated in several independent datasets.
Researchers first demonstrated that the frequency of observed dys-regulation in AD was highly correlated with the reproducibility of the dys-regulation. Based on this observation, they selected 100 genes with the highest frequency of dys-regulation to illustrate the core perturbation in AD brains, and the dys-regulation of these genes was validated in several independent datasets for AD.
After that, researchers further identified 12 genes with strong correlation of gene expression with disease progression. The relevance of these genes to disease progression was also validated in an independent dataset.
Also, researchers found an intriguing transcriptional “cushion” for these 100 selected genes in the less vulnerable visual cortex region, which may be a critical component of the protection mechanism for less vulnerable brain regions. In addition, they proposed the critical roles of several transcription regulators especially ZFP36L1.
To facilitate the research in this field, Prof. LEI and his team have developed a publicly accessible web server AlzBIG to make the relevant information available to the research community.
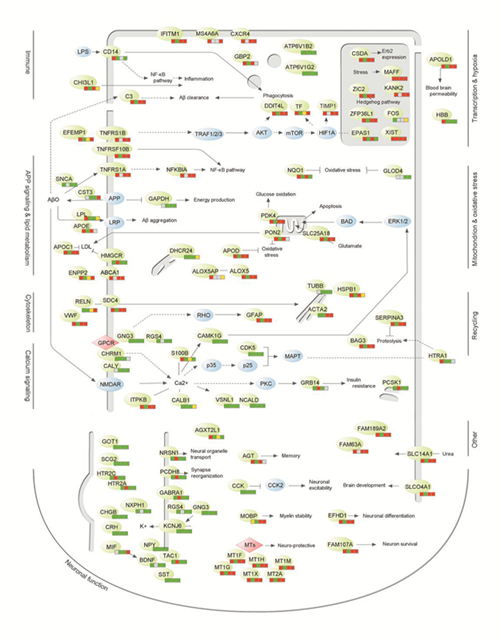
The top 100 genes selected based on AD brain transcriptome. The dys-regulation of each gene at the four major datasets are indicated by colored banner below the gene ID (red for up-regulation, green for down-regulation, yellow for mixed perturbation, and gray for non-perturbation). Selected 100 genes are indicated by light green color. Other important genes have been added to the map to enhance the functional connections. (Image by LEI's group)